INSPIRE partner Infordata has successfully completed the development of the INSPIRE Impact Dashboard, a comprehensive web-based platform designed for both private and public use. The dashboard provides interactive visualizations and analytical tools that enhance research, communication, and decision-making related to microplastic pollution and clean-water innovation.
The Impact Dashboard features two main workspaces tailored to different user needs:
- Private workspace for researchers: A secure environment for uploading datasets, performing analyses, and accessing detailed telemetry and modeling results.
- Public workspace for stakeholders: An open-access section that presents project progress through summary statistics, interactive charts, and maps, helping to foster wider communication and engagement.
Key features of the latest release include:
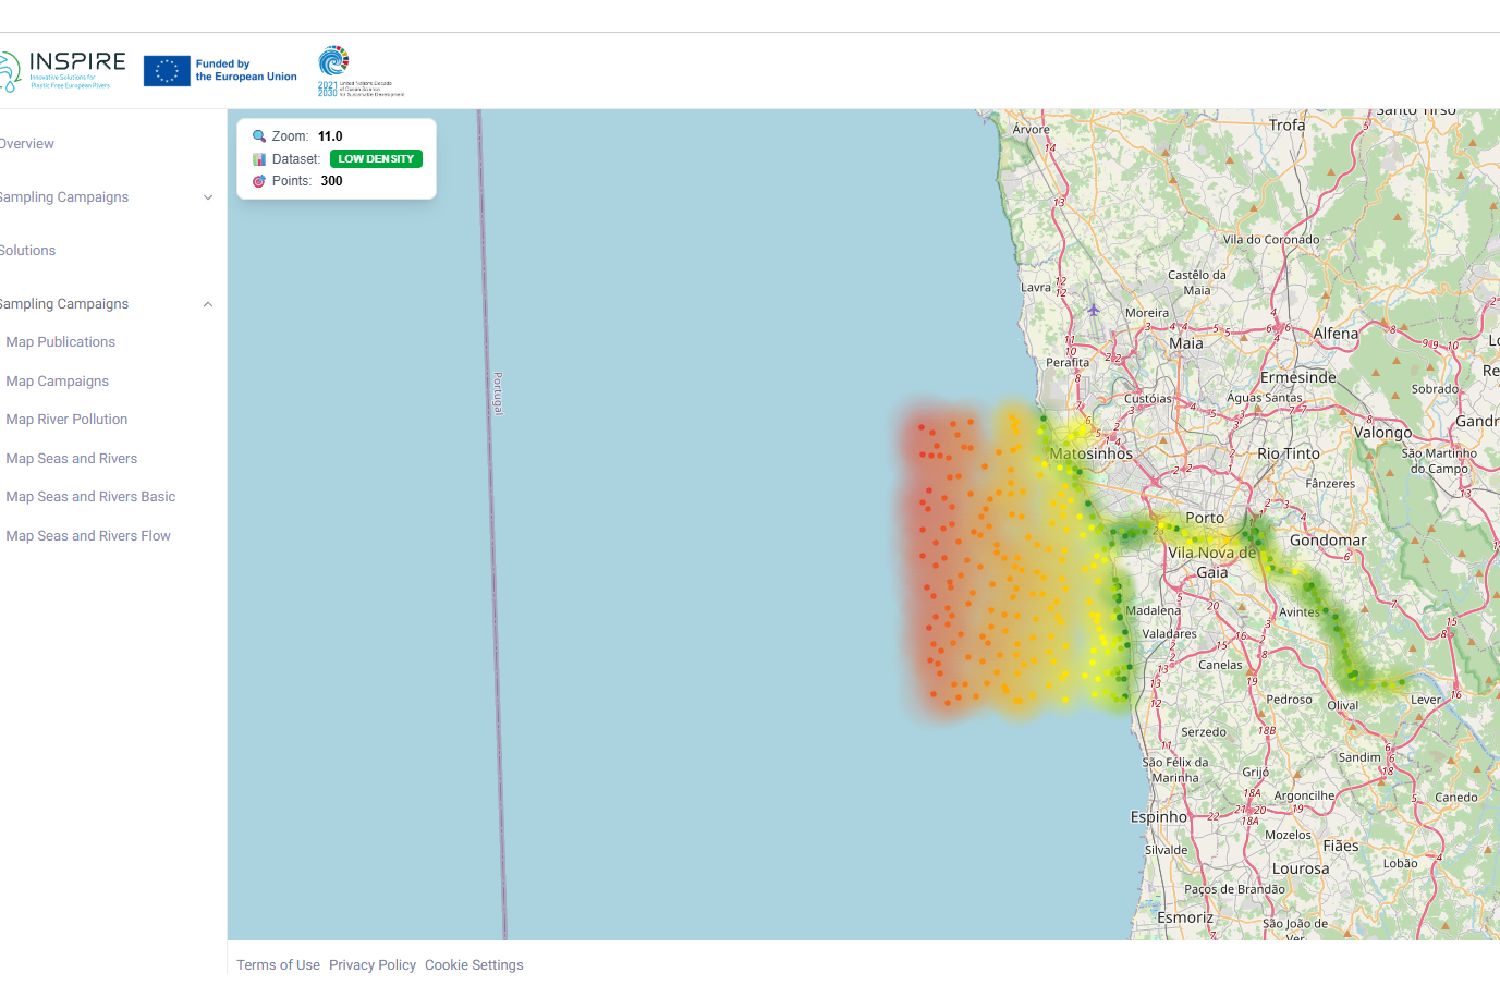
- 3D Globe with Riverline Integration: An interactive 3D map connected to the Riverline database, featuring approximately 24,000 georeferenced records with detailed attribute drill-downs.
- Hydrodynamic and Transport Views: Animated model visualizations—such as those of the Douro River—demonstrate flow dynamics and microplastic transport pathways to support hypothesis testing and scenario analysis.
- European River Pollution Insights: A continent-wide overview that aggregates modeled pollution indicators, allowing users to compare pollution levels, statistics, and microplastic accumulation across Europe.
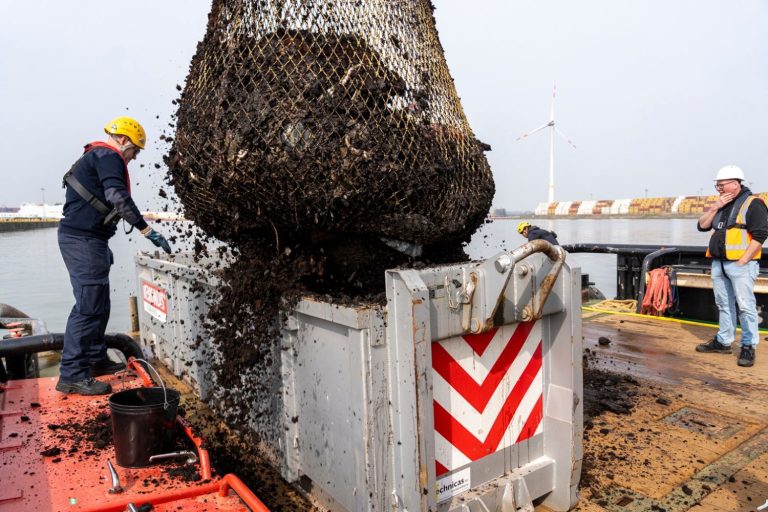
- AI-Enabled Sensing: Integration of an AI-assisted sensor stack that captures vibration, flow, and water-quality data upstream and downstream of technologies, improving performance diagnostics and yield estimation.
- LCA Roll-Out: The inclusion of initial Life Cycle Assessment (LCA) results for selected technologies, with more to be added as validation continues.
At a glance:
- One platform for multi-source, harmonized and FAIR-compliant microlitter data.
- Real-time operational visibility from field technologies.
- Comparable KPIs for benchmarking detection and collection solutions.
- Advanced visualization (3D globe, animated transport) for rapid insights.
- Standards-compliant formats and APIs for seamless integration.
The INSPIRE Impact Dashboard stands as a major milestone in the project’s mission to make data accessible, transparent, and actionable—empowering researchers, policymakers, and the public to better understand and combat plastic pollution in European waterways.